July 13, 2023
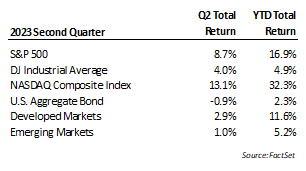
In what was probably a surprise to everyone given the headwinds entering the quarter, stocks did very well in the second quarter. Concerns about regional bank liquidity and commercial real estate were put aside early and the debt ceiling drama ended up being more a media event than a market one. Gains were not limited to the U.S. as most international markets also rose, with positive returns in developed and emerging markets. The bullish moves in the quarter came despite rates continuing to tick higher and Fed policy inclinations that remain stubbornly hawkish. Stocks were helped by the ongoing resiliency of the economy as several metrics suggested a recession is not yet imminent. The overall employment picture remains quite solid even after many companies announced layoffs while the pressure of inflation has been cooling. Prices are still rising but at a much slower rate than last year. There are still several reliable indicators that suggest a recession is on the horizon though the timing is being pushed out.
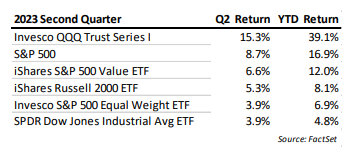
As has been the case in recent years, the performance of the markets was concentrated around a handful of stocks. In the past we had FANG (Facebook (now Meta), Amazon, Netflix and Google). This year we have had Apple, Microsoft, Amazon, and Nvidia. These were driven largely by the enthusiasm for Artificial Intelligence (AI). These stocks are held in ETF’s which focus on the QQQ and S&P 500, so most of our clients participated in the AI moves at varying degrees depending on diversification and targets. Interestingly, we find wide variation in index returns given the concentrated performance of these few stocks.
Concerning the euphoria surrounding AI, we recognize how these innovations can be another step forward for productivity but think expectations for how it might transform the fortunes of many companies may take longer to manifest than some investors are anticipating. We find it interesting that earnings expectations for the companies rising under the AI halo have not increased substantially along with the stock price. Earnings forecasts for Apple, Google, and Microsoft have not risen this year, and for some expectations continue to decline. Nvidia is the exception here where its graphic chips are well suited for running the AI processes that drive the technology. Consequently, it has seen its order book for chips expand dramatically.
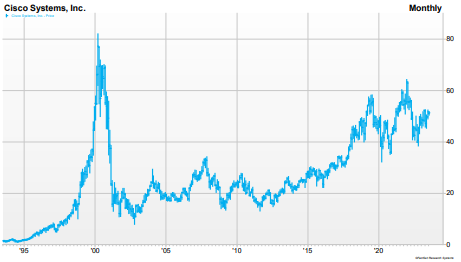
That said, buying Nvidia, or any investment after historically rapid gains (chasing returns) is a formula that loses more often than it wins in market history. Nvidia currently trades at a valuation of around 40x sales (which means it is very expensive when compared to the revenue the company is bringing in) meaning future competition, disappointment or even saner valuation multiples could mean there is downside risk. Nvidia shares may keep rising but if one gets in too late in the euphoria cycle, the wait to get back to even can take years or even decades. Below is a price chart for Cisco Systems, an anointed winner of the Internet evolution in 2000. Buyers near the peak of that bubble are still waiting to get back to even. During this time, Cisco remained a very good company, consistently growing and profitable, it just now trades at a more humble multiple of about 18x earnings.
At this stage, the definition of AI is very broad and has been used on everything from enhanced auto-complete to deeper authoring of ideas and responses. At its core, Generative AI is akin to a search engine on steroids, collecting vast amounts of electronic data and then applying more computing power to associate words and ideas. Some of these efforts look to combine problem-solving with automated machine actions. These capabilities are likely to change workforce requirements in several ways, akin to the way the economy has experienced other industrial and technological breakthroughs.
On that path, not every effort will be a winner. IBM Watson was an early version of Ai developed around 2010. The question-answering, chat-capable software was supposed to revolutionize healthcare research, customer service, and other business functions but was eventually shut down by IBM after falling short of business expectations. Current approaches to AI are certainly more capable but many may still fall short of the newfound lofty expectations. This landscape is evolving very quickly, and we will be watching closely to see where future economic opportunities develop.
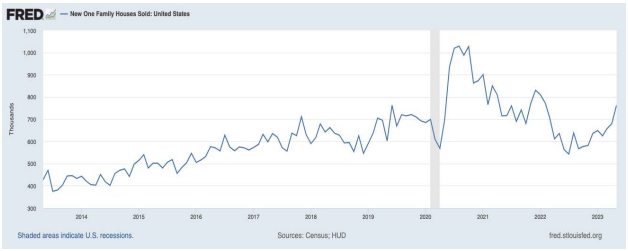
The second quarter saw economic conditions hold up better than what was expected as the year began. Forecasts that anticipated recession by mid-to-late this year have shifted to now looking for “soft-landing” scenarios sometime later down the road. Areas that have held up better than anticipated include new home sales, consumer spending on certain discretionary categories, business services, and jobs.
The speed and magnitude of rate hikes are feeding through economic activity differently than in previous cycles. For example, the rapid shift higher in mortgage rates has cooled the market for existing home sales (expected) but new home sales have flourished (not expected). Owners of existing homes are often reluctant to give up attractive mortgage rates secured earlier, forcing buyers that need housing to pursue new construction. To make the math even more attractive, builders are frequently buying down the rates for purchasers. This shift has resulted in an acceleration of new home sales over the past year, even as policy rates have moved sharply higher.
Also helping economic sentiment is an improvement in inflation trends. Price levels are still rising but at a far slower rate than experienced in mid-2022. Improvements in the supply chain, moving beyond the shock of the Ukrainian invasion, and lower energy prices have all contributed to slowing this upward pressure. Measurements in the rate of price change also benefit from comparisons to the elevated levels of last year. This has resulted in reported inflation trending “lower” this year with quoted changes substantially below the peak last year.
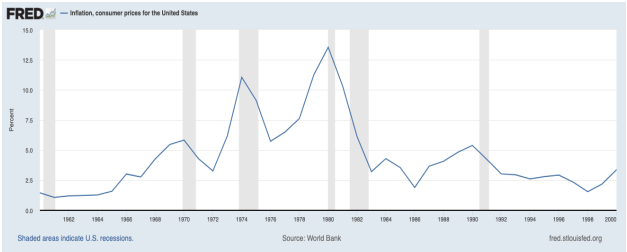
Annualized CPI is now below 5% while annualized PPI, a measure of price changes in the supply-side, has fallen below 2%. Because PPI is measuring price change in the supply change it can frequently be a leading indicator of where inflation is headed in the short term. However, the important question is whether inflation normalizes again at a modest level as had been the case pre-COVID, or experiences future surges. In the ‘70s, inflation came in a wave pattern with each surge higher than the previous. In the ‘70s, inflation was a long-term issue that challenged economic conditions for a decade. In our view, de-globalization and rising sovereign debt levels are two factors that could contribute again to a multi-wave pattern of inflation.
As noted before, the labor market is one factor in this expansion that continually held up better than expected. The just-reported June report was the first “miss” to expectations in 15 months, a streak far and away longer than any the economy has seen before. The shortfall was a modest disappointment notable given the long run of better-than-expected job gains. Looking closer at the data there are a few underlying indicators we think paint a less strong picture but until those factors show up in the survey data used by the Fed and media, policy inclinations will probably stay hawkish. Fed policy was obsessed with the CPI data when it was rising last year and now, as CPI is moderating, seems determined to not shift policy until the employment picture is weaker.
While economic activity has been better than expected and the risk of recession may have been postponed, we don’t think it has been eliminated. Economic research is pretty clear that changes in monetary policy work through the system with a lag. Even before this rate hiking cycle began, Chairman Powell spent time in his keynote address at the 2021 Jackson Hole Summit discussing how the Fed would need to move carefully when raising rates because of the 12-18-month lag that can transpire before effects are seen. Never before has the Fed moved this much, this fast, and in an economy with historically high leverage. Looking around, several substantial data points warrant an ongoing cautious view.
A couple of indicators with an extremely strong track record of predicting recession are yield curve inversion and Leading Economic Indicators (LEI). Yield curve inversion is when short-term rates are higher than long-term rates. The markets view the short-term rates controlled by policy as too constrictive and price long-term rates at a lower level on the expectation economic growth will slow. Currently, the three-month Treasury yields around 1.3% more than the 10-year, and the two-year is about 0.9% above that benchmark. These spreads are extremely wide and rank among the more significant inversion conditions markets have seen. Keep in mind, just because current conditions are not characterized as recessionary doesn’t mean this signal has failed. Looking at history, significant yield curve inversion can often occur during the time leading up to a recession. In those cases, interest spreads began to normalize coincident with the start of the recession. The logic is that short-term policy rates start to fall when the Fed acknowledges weakness.
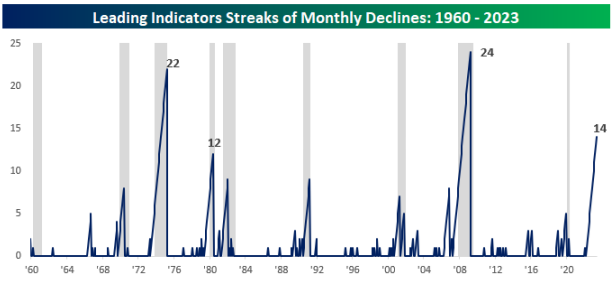
The Index of Leading Indicators put out by the Conference Board is another metric that has a good record of identifying prospective economic weakness. The Index, as the name implies, is a compilation of factors that attempt to catch early warning signs of trend changes in the economy. The measure uses a variety of inputs, among them stock price changes, interest rate spreads, and spending on housing and business investment. Through May, this Index has seen a decline for 14 straight months, a streak that in the past has been characteristic of the economy already in recession. The chart below from Bespoke Research illustrates consecutive runs of declines in the Index of Leading Indicators overlayed with past recession periods (gray shading).
The takeaway from these points is the economy appears to be operating with a wider range of highs and lows than typical. A lot of this is probably still due to the extremeness of the pandemic cycle. In the past two and a half years the economy ranged from an almost complete shutdown in activity to having trillions of stimulus dollars pumped in to foster recovery. Manufacturing, commercial real estate, and other interest-sensitive investments appear to now be feeling the hangover. On the other hand, discretionary spending remains strong and service businesses are seeing resilient demand. The longer these trends can continue, the more hopeful market forecasters become for a soft landing.
The risk to the soft-landing scenario is that the areas that have held up better than expected thus far will run into trouble. Consumer spending on vacations, cars, and new homes will face growing competition for discretionary dollars as costs for insurance, maintenance, and taxes rise. Later this year, if student loan repayments moratoriums are lifted as now planned, it will be another expense that consumes a portion of income. Some of this spending has been supported by the accumulated savings from pandemic stimulus payments. Research indicates this pool of excess savings will be depleted by the second half of 2023. Already we have heard companies like Costco, Walmart, Target, and Home Depot point to signs of consumers “trading down”. So far, the aggregate impact on the economy has been small but it is worth keeping an eye on.
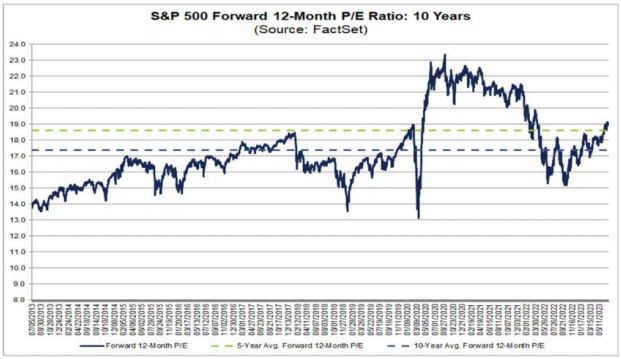
Regardless, as investors we are aware that even pricing in a soft-landing scenario has gotten more expensive as the year has progressed. In the face of the market’s gain through the first half, earnings expectations (S&P500) have trended lower. The decline in expected earnings this year, about 5% lower according to Factset, is much better than the rate of decline last year but the trend has yet to trough. The implication is the stock valuation has gone up materially. The S&P500 started the year with a forward earnings multiple of about 16x and now trades closer to 19x the estimate of earnings. Not an egregiously expensive level, but on the high side of the historical range over the past 10 years (source: Factset). What the stocks need now is more earnings growth and less multiple expansion.
Fortunately, the investment landscape offers more attractive diversification alternatives than in recent years. While cash and short-term U.S. Treasuries haven’t kept pace with stocks year to date, they do offer a yield nearing 5%, or more, with much less volatility risk – far better than a few years ago. Given the uncertainties in the outlook and elevated valuation, we think an elevated buffer of lower-risk assets makes sense in portfolios. In our opinion, the retracement in inflation experienced over the past year is closer to a trough than not. We remain guarded against future resurgent inflation and believe commodities still offer an opportunity to protect investors from that risk. While we are happy to have the debt ceiling circus behind us, the open-ended borrowing capacity of the legislation could be a spark for further inflation. Regardless, as these developments unfold, we will continue to communicate any changes in our view and corresponding implications for client allocations. We thank you for your continued trust in us and hope you and your family remain in good health.
Bradley Williams, Chief Investment Officer
Lowe Wealth Advisors
Please remember that past performance may not be indicative of future results. Different types of investments involve varying degrees of risk, and there can be no assurance that the future performance of any specific investment, investment strategy, or product (including the investments and/or investment strategies recommended or undertaken by Lowe Wealth Advisors, LLC), or any non-investment related content, referred to directly or indirectly in this newsletter will be profitable, equal any corresponding indicated historical performance level(s), be suitable for your portfolio or individual situation or prove successful. Due to various factors, including changing market conditions and/or applicable laws, the content may no longer be reflective of current opinions or positions. Moreover, you should not assume that any discussion or information contained in this newsletter serves as the receipt of, or as a substitute for, personalized investment advice from Lowe Wealth Advisors, LLC. To the extent that a reader has any questions regarding the applicability of any specific issue discussed above to his/her situation, he/she is encouraged to consult with the professional advisor of his/her choosing. Lowe Wealth Advisors, LLC is neither a law firm nor a certified public accounting firm and no portion of the newsletter content should be construed as legal or accounting advice. A copy of the Lowe Wealth Advisors, LLC’s current written disclosure statement discussing our advisory services and fees is available upon request. If you are a Lowe Wealth Advisors, LLC client, please remember to contact Lowe Wealth Advisors, LLC, in writing, if there are any changes in your personal/financial situation or investment objectives to review/evaluating/revising our previous recommendations and/or services.