January 18, 2021
In the final quarter of 2020, stocks posted their third consecutive gain after the big slide in the first quarter when COVID emerged in the U.S. Tech stocks continued to be among the best performers, though the fourth quarter finally saw a lift in lagging sectors like energy and financials. Bond yields moved a bit higher during the quarter (prices lower) but overall rates remained far below the levels at the start of 2020. The rebound in stocks was not limited to the U.S. as international markets also saw solid gains in the fourth quarter with several countries outperforming the U.S. – a rarity in the past several years.
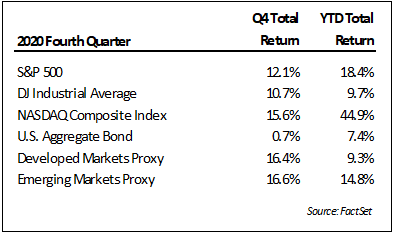
The stock gains in the quarter came as markets looked beyond the resurgent COVID numbers and embraced the potential vaccine efficacy along with expectations for still more stimulus. By the end of the year, many markets saw stocks trading at new all-time highs. As the flashpoints of uncertainty receded, markets broadly embraced risk assets. Many high-flying stocks spurted still higher while there was a resurgence in sectors that previously had lagged like value and small-cap. The positive spin focused squarely on the rate of change, rather than absolutes. Better COVID numbers (hopefully) due to vaccines, improving corporate earnings (off the shutdown lows), and more anticipated financial stimulus (1.9 trillion proposed) were among the justifications for pushing stocks higher. Any of these drivers could still face big challenges, but in the meantime, markets were again concentrated on the most optimistic scenarios of recovery.
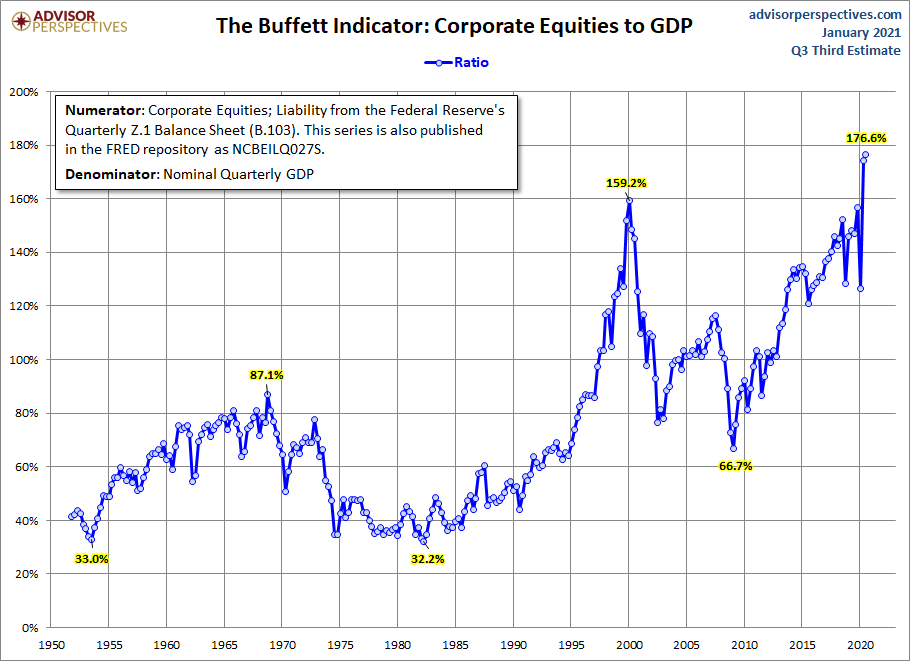
We wouldn’t argue with the notion that certain health and economic variables started to look more promising as the end of 2020 neared, however, the enthusiasm with which certain areas of the market are being embraced is becoming more concerning. Examples of money-losing companies seeing their IPO double on the first day of trading, huge demand for blank-check companies (SPACs), and wild price movements on rather inconsequential news were all widely evident in the fourth quarter and all similar features to the late stages of past asset bubbles. Fear of missing out and the idea that any downturn will see a quick and painless recovery has prompted investors to press their bets and in turn made the current market, according to many measures, the most expensive in history. The graph below is a high-level comparison of total stock value to the size of U.S. GDP.
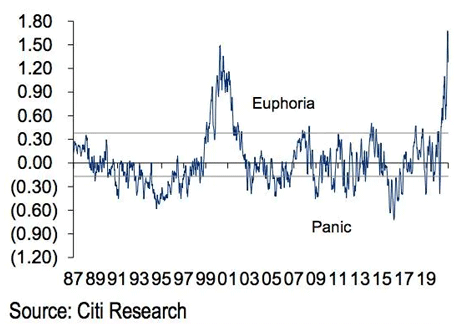
Among the most expensive in an overwhelmingly pricey market are a growing number of companies trading at levels difficult to fully describe. Stock prices for some of the most faddish companies equate to valuations over 50x sales. To put this in some perspective, at 50x earnings the implied earnings return on investment would be 2% per year. Applying similarly lofty multiples to revenue excludes expenses, taxes, impacts of eventual competition, and other factors that are necessary to determine when an investment is recouped and generates a cash return. The reality for most of these stocks is a substantial risk of significant drawdown which for some may never be recouped. This was the experience of past asset bubbles including the tech bubble in 2000 where even the most successfully executing companies in the fastest growing sectors saw major declines from their stock highs. Those that did recoup prior highs in most cases needed many years to do so. While the dramatic gains experienced by the most chased after stocks may seem irresistible, history has shown in similar times this is when caution is most warranted. As can be seen in the chart below, risk-taking enthusiasm in this market is extremely high.
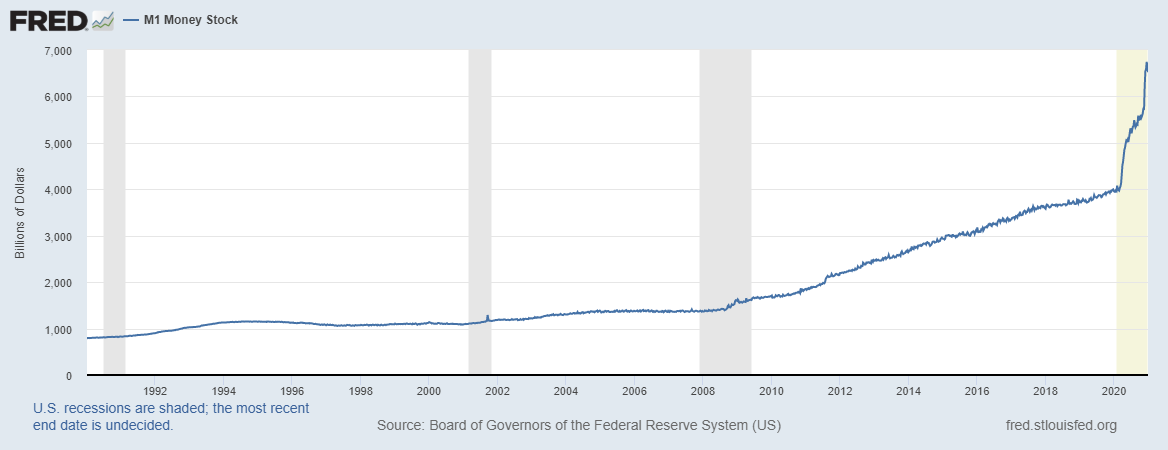
In our opinion, the rise in aggressive speculation has been fueled by aggressive financial policies in response to COVID. The monetary stimulus provided by the Fed has been a continual theme through this long expansionary cycle. Responding to the pandemic left the only option to go even bigger. While much of the initial response may have been necessary due to the widespread and immediate shutdown of large swaths of the economy. However, the problem with these rescue programs is they never seem to fully find the exit. The chart below is M1, or demand deposit cash as a measure of the most liquid money in the economy. The chart shows both the steady rise through this expansion and then the flood of response unleashed by the COVID programs. However, this graph also shows that 10 months after the start of those pandemic programs, liquid money in the system is still rising at a dramatic rate. More money chasing a similar amount of goods and services increases the risk of inflation and a loss of purchasing power. We believe this topic will garner a lot more attention moving forward.
We don’t expect sharp reductions in monetary intervention will come easy. The Biden victory in November followed by the election of both Democrats in the early January Georgia runoff has aligned a political structure willing to enact large spending initiatives. While Democrats also ran on a platform of increasing taxes, however, the proposals, even if passed, would not raise nearly enough funds to offset the expected increase in spending. The bottom line is the deficit for 2021 could again be north of $3 trillion which would likely require significant monetization to cover the gap. Interest rates close to record lows make it highly unlikely this supply of additional Treasury issuance could be met in the market otherwise.
The prospect of additional stimulus coupled with an increase in economic mobility enabled by vaccines could hold the potential for above-normal growth in 2021. Currently, the consensus estimate for S&P500 earnings in 2021 is $168, or about a 3% increase from what stocks in the index earned in 2019 (source: Factset). This estimate has been rising and could go still higher depending on the size and composition of the new stimulus legislation. Consequently, estimates for economic growth of 4% or 5% are now being discussed, though, given the estimated contraction experienced in 2020, 4% growth in 2021 would put the U.S. GDP at roughly the same level as in 2019. If all the bullish cards fall in place, some forecasters are then looking into 2022 S&P earnings to approach $200. Regardless, even moderate growth in 2021 would be a welcome improvement after the pain of 2020 and with the investor focus on rate of change, could be supportive for stock prices.
The spending and debt monetization that will likely be necessary to achieve this growth may result in increased inflation. Higher inflation as a result of past policies has frequently been expected (including by us) but seeing it in government statistics has so far been elusive. Effectively putting newly printed money directly in the hands of consumers likely to spend the money, however, raises the likelihood price increases will be more widely reflected and eventually evident in published statistics. Further adding to upward pressure, prices could also be impacted by supply disruptions, some emanating from COVID and others from the geopolitical shifts at work.
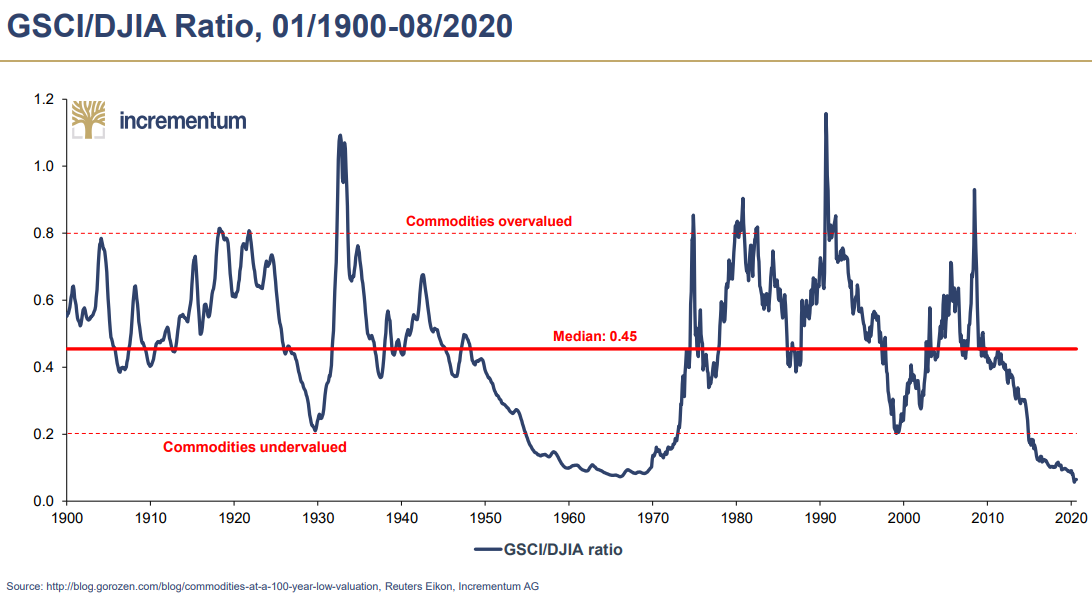
Interestingly, since the election commodities covering a wide variety of goods have seen significant price increases. In late 2020 we added more commodity exposure in some of our strategies via energy and international funds. In 2021 we may look to increase these weightings given the relative values to large-cap U.S equities. Commodity related investments have been a particularly difficult investment area for several years, but cycles of rising prices can come quickly and be substantial in magnitude. If markets are embarking on a relative shift, it could have substantial time and price opportunities to play out. The following chart from Incrementum compares the relative value of the Goldman Sachs Commodity Index to stocks over the past century. The relative lag in commodity prices over the past years results in one of the most attractive relative valuation points in the past hundred years.
Bonds, on the other hand, are becoming riskier as rates continue to fall. Central bank rate suppression around the world has driven market rates close to zero or, in several cases, below. Historically, bond prices would rise during periods when stocks fell and in periods where bond prices might fall, returns were offset with coupon payments. With nominal rates close to zero, bond prices are more sensitive to rate changes while coupons are so low there is little income to offset potential declines in price. As a result, we have generally avoided longer maturity bonds, but now with shorter terms offering so little yield, bond allocations across all our strategies are being reduced. Cash and cash-like portions of client allocations are currently higher than typical and we anticipate it will stay somewhat elevated to offer flexibility. While the markets have been quite firm post-election, we don’t expect the sailing will remain so smooth through the rest of the year.
After all the events of last year, predicting how 2021 will unfold seems near impossible. There are so many variables yet to unfold that could prove quite supportive, or turn into new risk factors for investors to digest. Rather than forecast where markets might go in 2021, our focus will remain on allocating your capital to maximize long-term, risk-adjusted returns. Sometimes that means holding lower-yielding assets or cash to preserve value. Based on history, we believe there are growing segments of the financial markets that do not offer attractive long-term return potential. That doesn’t imply there will not be more IPOs that double the first day or compelling technology companies that overnight achieve nose-bleed valuations, but it does mean that if the music stops for this speculation, the drawdowns for some of these high-fliers could be steep and rapid. As these developments unfold, we will continue to communicate any changes in our view and corresponding implications for client allocations. We thank you for your continued trust in us and hope for good health.
Bradley Williams, Chief Investment Officer
Lowe Wealth Advisors
Please remember that past performance may not be indicative of future results. Different types of investments involve varying degrees of risk, and there can be no assurance that the future performance of any specific investment, investment strategy, or product (including the investments and/or investment strategies recommended or undertaken by Lowe Wealth Advisors, LLC), or any non-investment related content, referred to directly or indirectly in this newsletter will be profitable, equal any corresponding indicated historical performance level(s), be suitable for your portfolio or individual situation or prove successful. Due to various factors, including changing market conditions and/or applicable laws, the content may no longer be reflective of current opinions or positions. Moreover, you should not assume that any discussion or information contained in this newsletter serves as the receipt of, or as a substitute for, personalized investment advice from Lowe Wealth Advisors, LLC. To the extent that a reader has any questions regarding the applicability of any specific issue discussed above to his/her situation, he/she is encouraged to consult with the professional advisor of his/her choosing. Lowe Wealth Advisors, LLC is neither a law firm nor a certified public accounting firm and no portion of the newsletter content should be construed as legal or accounting advice. A copy of the Lowe Wealth Advisors, LLC’s current written disclosure statement discussing our advisory services and fees is available upon request. If you are a Lowe Wealth Advisors, LLC client, please remember to contact Lowe Wealth Advisors, LLC, in writing, if there are any changes in your personal/financial situation or investment objectives to review/evaluating/revising our previous recommendations and/or services.