July 23, 2015
The U.S. equity market (S&P500) saw a total return of 0.7% in the second quarter to deliver a year-to-date total return of 1.2%. (FactSet) Price return for the index is barely up for the year, meaning that the majority of total return came from dividends. Equity returns managed the flat to slightly positive performance against a back-up in interest rates off the historically low levels reached in the first quarter. Broadly, market returns were looking better by a couple percent in mid-June before the credit deadline and the growing impasse of a debt solution for Greece prompted a global sell-off in the markets. Fixed income markets remained focused on the commencement of any rate increases here, although the data and commentary from the Fed continues to see the timing for those expectations pushed back.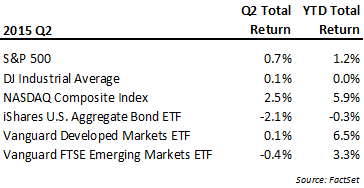
The late quarter selling prompted by the upheaval in Greece also coincided with a sell-off in mainland Chinese markets, two factors which both continued on into early July. Chinese exchanges in Shanghai and Shenzhen, where “A-Shares” in local companies are traded, have seen triple digit gains achieved in less than a year significantly clipped in a span of weeks. Speculators, day-traders and even companies chased the momentum in the local stock prices, often in firms with scant financial reporting or little substance. However, as with the tech stock bubble here, rapid price appreciation with little underlying fundamental justification eventually sees its reconciliation. While this is undoubtedly a very disruptive development for these emerging exchanges, in our opinion the implications outside of China will not be as widely felt as had this type of equity decline occurred in other developed markets. Earlier this month we published a more detailed commentary to add some perspective on the Chinese market developments and it is available HERE.
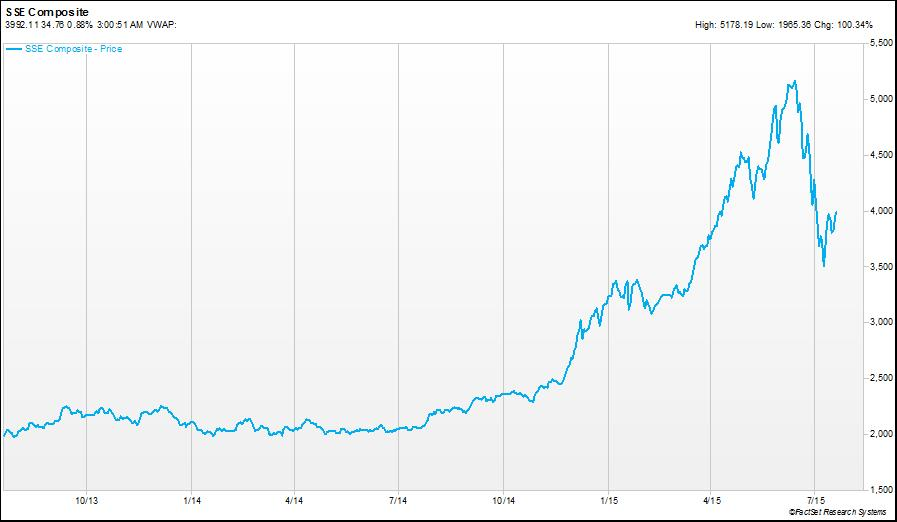
A big reason why we think the impacts will be more muted outside the Chinese economy is that these exchanges have much less foreign participation. In fact just looking at the price moves of the surrounding markets in the Asia Pacific region reflected much more subdued moves, both on the upside and downside. Further, in many cases we think the markets of other countries in the region still represent attractive relative value. As a point of reference, the price-to-earnings (P/E) multiple at the end of June on the Hong Kong Hang Seng Index was around 11x versus an estimated peak median P/E on the A-Shares market exchanges of approximately 50x (Source: Matthews Asia).
Now a few weeks into July, both the Greek crisis and Chinese market decline have receded from peak concern for the markets, although we suspect neither issue is fully resolved and could remain a source of volatility. The concern for global financial markets from either situation is to what extent the disruption impacts the trade, growth and investment of surrounding economies in the future. In each case, we don’t yet know the full answer. As we do in evaluating other sources of risk for our investments, we will look to avoid situations where we believe the potential returns do not offer fair compensation – such as 50x P/E valuations seen in the local Chinese markets.
Here in the U.S. the economic trends in the second quarter improved from the contraction seen in the first quarter, although the magnitude of the bounce was less than seen last year. The overall growth trajectory of our recovery continues to trail that of past experiences, but nonetheless it continues to advance. Employment, housing, vehicle sales and retail sales have all continued on a trend of moderate expansion, although with vehicle sales and retail sales the pace of growth has moderated. In addition to monitoring these factors, we also pay attention to other indicators that suggest shifts in risk taking that could impact future growth. For example, with car sales we are watching the extension of terms and expansion of lower quality credit score loans underwritten to maintain the current sales pace. Just last month the credit rating firm Experian reported that the average term on new and used vehicles reached all-time highs of 67 and 62 months, respectively, while average credit scores have declined. Should delinquency or default rates start to increase significantly, this could become a real challenge to retail sales.
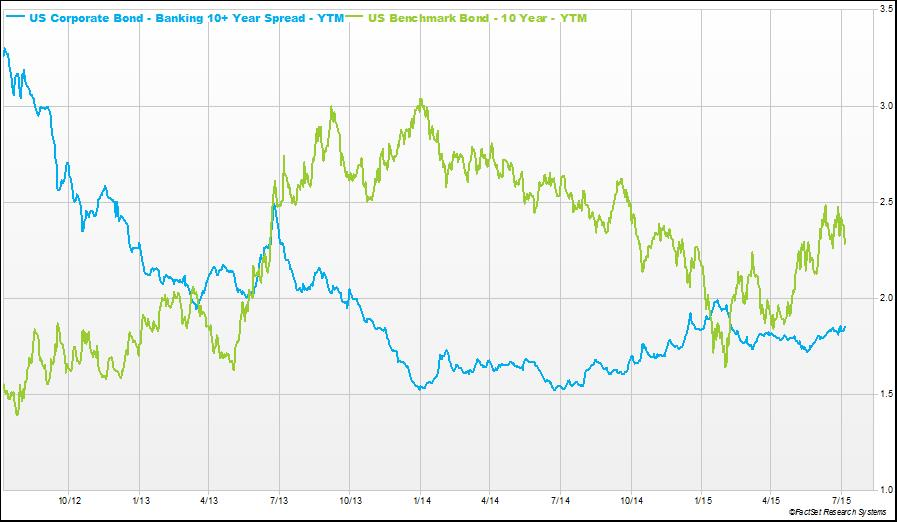
However, overall risk assessments on credit viewed through bond spreads (blue line in chart below) suggest the read on our economy and debt issuers hasn’t changed significantly this year. The lower the blue line is in this chart, the lower the risk perception is among fixed-income investors. This three year chart also shows the absolute level of risk spreads remain at low levels relative to the past.
Actions we took in portfolio strategies during the quarter involved fine tuning adjustments rather than major reallocations – a reflection in part to an economic recovery here that continues to plod along. In certain of our investment strategies we sold a water-focused industrial ETF and a regional bank ETF, realizing some gains and increased our exposure to the healthcare sector through the purchase of an industry focused ETF. Healthcare has been one of the top performing sectors during this bull market cycle, but we believe it is for good reason as the industry has seen among the best relative sales and earnings growth results during this cycle (see chart below for sector revenue growth expectations for 2015). We believe is in part due structural developments like spending driven by Obamacare and demographic changes that will remain tailwinds for the industry for some time to come. 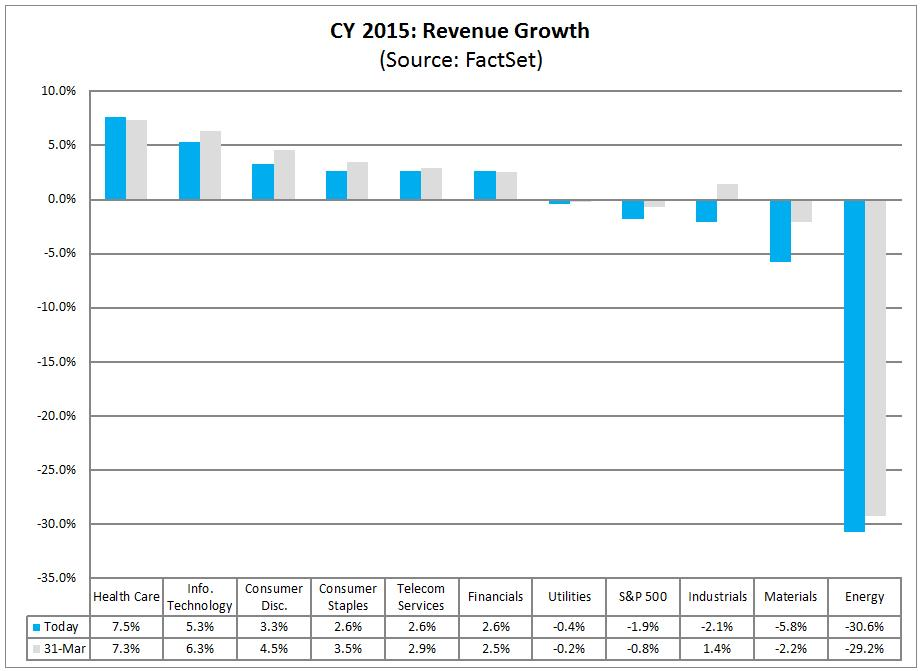
Additionally, we used cash balances in multiple strategies for investment in short term staggered maturities of investment grade bond ETFs. Each of these ETFs hold a diversified list of high quality bonds all maturing at approximately the same time. Yields for these securities are only in the mid 1% to 2% range, but are definitely better than near zero rate cash alternatives and should have minimal sensitivity to market rate changes due to the short maturities. Our view continues to hold that the road to substantial rate increases by the Fed faces many challenges, but even so we are reluctant to take on long-dated maturities in a world of historically low rates.
In our opinion, the swings in the market seen over the past several weeks bear watching for more significant shifts in the financial market’s perception of risk. Dramatic moves in China and Greece demonstrate how quickly things can change on only a small move in expectations. We attempt to pay attention to these signals as we do for data and trends in our market and economy in the face of what has now been a lengthy expansion. While several of the indicators we follow here in our domestic market have remain more subdued, we recognize perceptions can change quickly. We don’t expect to be able to precisely anticipate that change in risk assessments, but in defense of that we will continue to manage our risk by avoiding markets and assets classes that appear at the greatest extremes.
Bradley Williams
Chief Investment Officer
Lowe Wealth Advisors
Lowe Wealth Advisors is an SEC registered investment adviser that maintains a principal place of business in the State of Maryland. The Firm may only transact business in those states in which it is notice filed or qualifies for a corresponding exemption from such requirements. For information about the registration status and business operations of Lowe Wealth Advisors, please consult the Firm’s Form ADV disclosure documents, the most recent versions of which are available on the SEC’s Investment Adviser Public Disclosure website at www.adviserinfo.sec.gov.
This commentary is intended for the dissemination of general information regarding market conditions to Lowe Wealth Advisors clients. The information contained herein should not be construed as personalized investment advice. Past performance is no guarantee of future results, and there is no guarantee that the views and opinions expressed in this report will come to pass. While any general market information and statistical data contained herein are based on sources believed to be reliable, we do not represent that it is accurate and should not be relied on as such or be the basis for an investment decision. Any opinions expressed are current only as of the time made and are subject to change without notice.