Volatility Returns
April 19, 2018
The remarkable calm enjoyed by the markets last year finally gave way in January of this year. Following early gains to start the year, equity markets reversed abruptly in late January and saw sharp declines on concerns over higher interest rates and trade policy. February and early March then saw the stock market trade in a back-and-forth manner and at the end of the quarter, most equity indices had experienced modest losses. The negative quarterly return for the S&P500 broke a streak of nine consecutive quarters of positive total return going back to the fourth quarter of 2015. However, for perspective, most major equity indices remain well above levels seen as recently as last November given the very strong market gains experienced in late 2017.
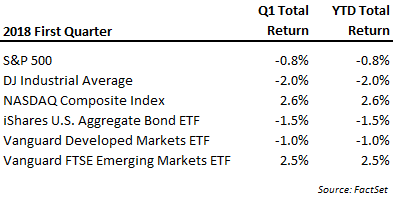
Bonds values also declined in the first quarter as interest rates continued their rising trend from late last year. Market interest rates were up about a third of percent over the course of the three months and reflected the 0.25% rate increase levied by the Fed in March and the current solid economy conditions. Presently, the Fed plans for at least two additional similar increases later this year. In our opinion, executing on this plan will at the least require economic growth to be at or above current conditions and even still may present some challenges. The economic expansion experienced this cycle has come with a substantial increase in borrowing, making future economic growth even more sensitive to changes in interest rates.
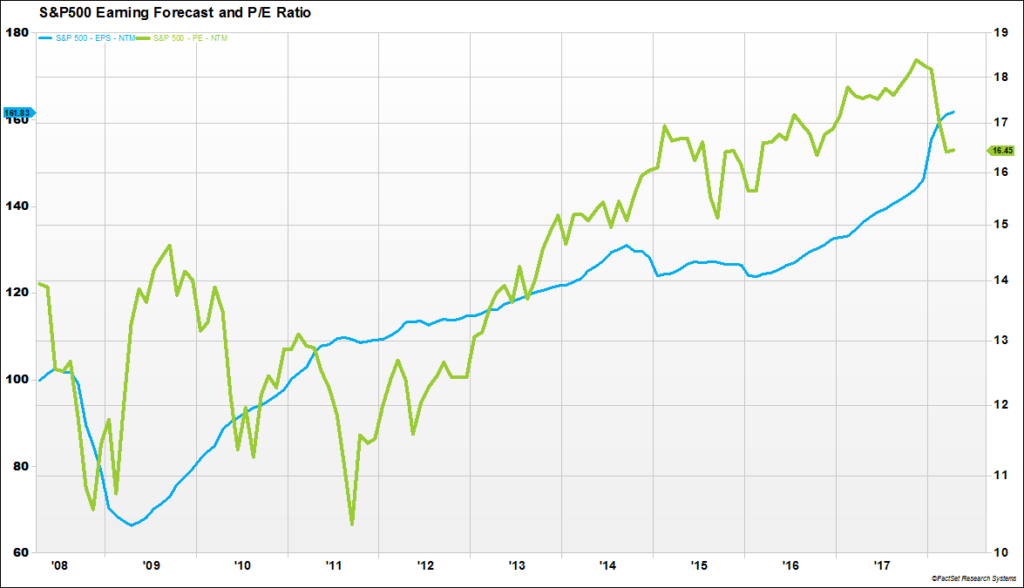
Stocks started the year on a very positive note fueled by the optimism stemming from the new tax plan. As we noted last quarter, large corporations were among the biggest beneficiaries and that was reflected in one of the largest ever one-month jumps in S&P500 earnings estimates (following graph – blue line). A lower tax rate for some businesses had the immediate effect of raising the outlook for earnings and, in the process, somewhat moderating at least one of the variables implying an excessive valuation level on stocks. While this is incrementally good news for the price/earnings measure (following graph, green line), it remains elevated relative to history and several other measures (cash flow, price to sales, price to book) still show U.S. equities as being quite richly valued.
The boost to corporate earnings from the tax plan is likely to further lengthen this already long economic expansion cycle. This expansionary cycle has now roughly equaled that of the second longest in history and looks well positioned to continue further. Signs in domestic activity are not yet flashing concerning signals. Confidence, both among businesses and consumers, continues at high levels and this is reflected in surveys on spending plans. Employment, though a lagging indicator, also remains strong with most of the focus now on the degree to which the tight labor market might accelerate wage growth – a factor that could play into an increase in inflation.
Financial markets, however, could price in risks to future growth before they show up in many economic measures. The most significant threat to this expansion may continue to lie with interest rates. Over the course of an expansionary business cycle, leverage typically increases and capital can tend to chase greater returns (risks) as confidence builds. When interest rates rise, it increases the cost of capital and can reveal return risk from questionable investments. With rates reaching historic lows this cycle, the increase in borrowings has been substantial.
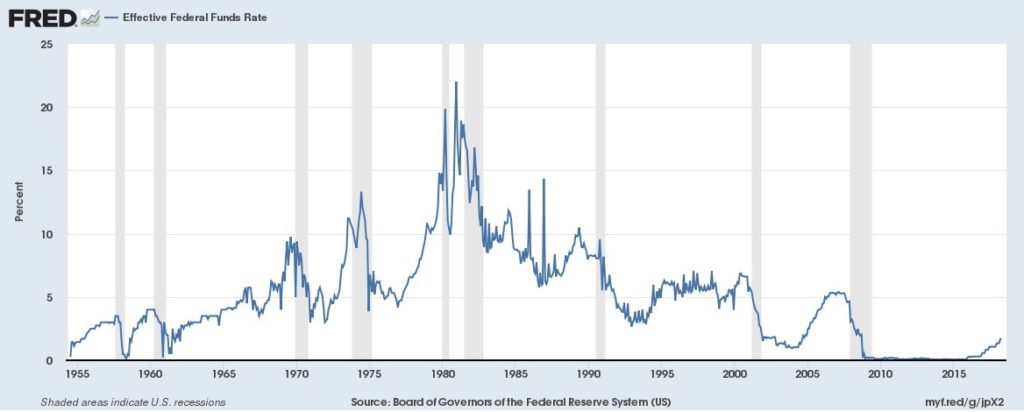
This is why the Fed is often the protagonist in the business cycle story, including the eventual turn to recession. The following chart tracks 60 years of Fed Funds history along with shaded recessionary periods. Not every policy shift to higher rates has resulted in a recession, but every recession has coincided with the Fed implementing a policy of multiple interest rate increases. It’s impossible to know in advance the tipping point, but the trend bears watching given the history.
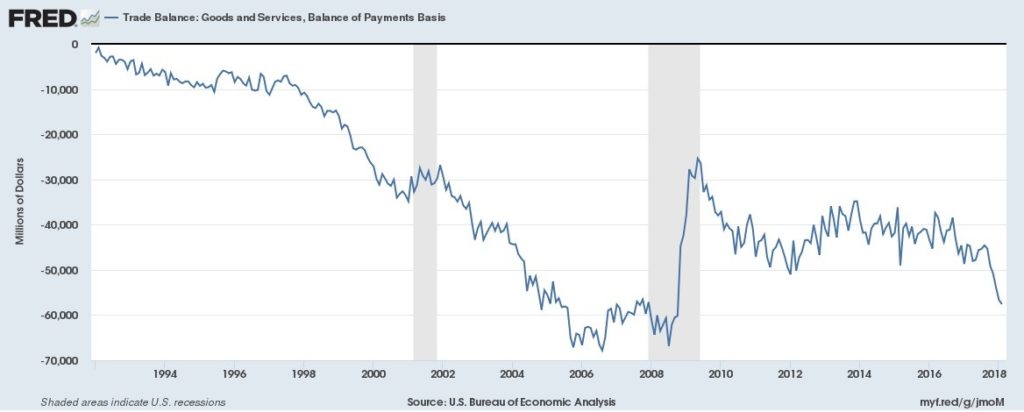
Aside from economic trends discussed, the market is clearly facing a growing list of outside catalysts or risks. The most prominent among these this year has been related to trade, although geopolitical confrontations are escalating quickly as well. Foreign trade is a wildcard on how economic growth in the coming years may unfold and it is an issue that will not likely go away quietly. The trade balance for the U.S. has been in long-term decline, even despite the recent increase in U.S. petroleum exports. Now that the issue of trade is on the front burner for this administration we don’t think there will lessening of rhetoric or initiatives until some form of “victory” is achieved.
The initial U.S. tariff initiatives on washing machines, metals and solar covered a relatively small portion of the total trade. The Chinese, being principal targets of the actions, responded with tax proposals on aircraft, automobiles, and soybeans, impacting a larger aggregate value of trade. Where the action/reaction process ends if difficult to say, however, it is clear that further escalation of a trade war could have many detrimental ramifications for global economic activity. The actions so far have not driven direct changes in portfolio allocations, but as these concerns flare up it has reinforced some prior actions to add more defensive positions to client accounts.
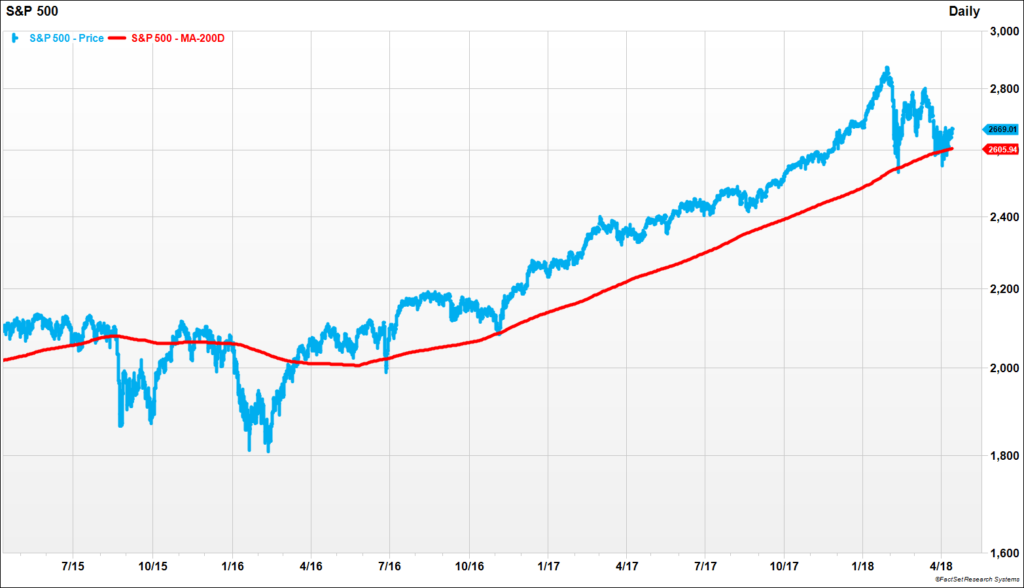
The economic growth here and in the rest of the world offset by a growing list of risk factors comes against an interesting backdrop for equity markets. The bull market for stocks since early 2009 has seen few corrections and among these, the last most significant pullback was in early 2016. Many market participants watch underlying trend lines, being more bullish when stocks are above an increasing trend line and more bearish if below. The correction in the first part of 2018 has brought the S&P500 right to the level of one of the most popular of these trend lines, the 200-day moving average (see chart – red line). We note this significance as the widely watched measure can have more influence on subsequent trading whether stocks successfully stay above the trend or breakthrough. At this time resolution is yet to come, but we would not be surprised to see the market fall below and stocks see a somewhat more lengthy correction than experienced so far.
Protecting capital in this environment is a growing challenge but one of very high priority in contemplating any moves, adds or changes to portfolios. Historically bonds have provided a good offset and positive return in times of stock declines. In the first quarter, when stocks declined bonds fell too, making the simultaneous decline of both asset groups a somewhat unusual occurrence. After years of declining rates, bonds, unfortunately, offer less of a risk buffer than they have historically. Still the risk of loss to shorter-term, higher quality debt remains substantially less than other risk assets while rising rates lessen the pain a bit through increasing interest payments. Should rates rise more and/or faster than the market expects we believe the risks to these assets will be substantially less than those to risk assets such as high yield debt and stocks.
For stocks, we don’t think the volatility burst experienced this year is enough to declare the end of the long-running bull market. Nonetheless, there are more challenges on the horizon and no one can argue we are in the early innings of this expansion. Our intentions at present remain to err on the conservative side of allocation decisions. What may be foregone in incremental returns could quickly be more than offset should trends move in an unfavorable direction more quickly than people expect. As these developments unfold we will continue to communicate any changes in our view and corresponding implications for client allocations.
Bradley Williams, Chief Investment Officer
Lowe Wealth Advisors
Please remember that past performance may not be indicative of future results. Different types of investments involve varying degrees of risk, and there can be no assurance that the future performance of any specific investment, investment strategy, or product (including the investments and/or investment strategies recommended or undertaken by Lowe Wealth Advisors, LLC), or any non-investment related content, made reference to directly or indirectly in this newsletter will be profitable, equal any corresponding indicated historical performance level(s), be suitable for your portfolio or individual situation or prove successful. Due to various factors, including changing market conditions and/or applicable laws, the content may no longer be reflective of current opinions or positions. Moreover, you should not assume that any discussion or information contained in this newsletter serves as the receipt of, or as a substitute for, personalized investment advice from Lowe Wealth Advisors, LLC. To the extent that a reader has any questions regarding the applicability of any specific issue discussed above to his/her individual situation, he/she is encouraged to consult with the professional advisor of his/her choosing. Lowe Wealth Advisors, LLC is neither a law firm nor a certified public accounting firm and no portion of the newsletter content should be construed as legal or accounting advice. A copy of the Lowe Wealth Advisors, LLC’s current written disclosure statement discussing our advisory services and fees is available upon request. If you are a Lowe Wealth Advisors, LLC client, please remember to contact Lowe Wealth Advisors, LLC, in writing, if there are any changes in your personal/financial situation or investment objectives for the purpose of reviewing/evaluating/revising our previous recommendations and/or services.